Monitoring with Prometheus
Contents
Introduction
Prometheus is an Open Source time series metric based monitoring system. When combined with Grafana it is possible to create dashboards and alerting for your GivEnergy’s system.
Requirements
In order to monitor your GivEnergy’s system, the following software needs to have been set-up:
GivEnergy TCP
GivEnergy TCP is an Open Source project that will open a connection to GivEnergy inverters via TCP modbus. Using this connection, GivEnergy TCP can expose the metrics from your inverter via MQTT. Although Grafana has support for a MQTT data source, it does not support alarms and when I tested it with GivEnergy TCP there were often gaps in the data feed from my inverter.
I therefore decided to extend the GivEnergy TCP project to add a Prometheus exporter.
GivEnergy TCP Prometheus Branch
At the time of writing, my pull request for my Prometheus exporter for GivEnergy TCP is currently open.
In the meantime, the Prometheus exporter can be found at https://github.com/neilmunday/giv_tcp/tree/prometheus.
To make use of the Prometheus exporter, proceed as follows:
git clone -b prometheus https://github.com/neilmunday/giv_tcp
cd giv_tcp
docker build -t britkat/giv_tcp-ma:2.2.3 -f Dockerfile .
Now edit the docker-compose.yml file and make sure that you set the appropriate values for the following variables:
NUMINVERTORS- set to the number of inverters you want to monitor. Default = 1.INVERTOR_IP_1- set to the IP address of your inverter.MQTT_OUTPUT=False- Disabled MQTT server.PROMETHEUS_EXPORTER=True- Enable the Prometheus exporter.PROMETHEUS_PORT=6711- Set the port that the Prometheus exporter will listen on.WEB_DASH=False- Disable the web dashboard for GivEnergy TCP.
Warning
Make sure you replace all occurences of port 3000 with another available port (e.g. 3080) to avoid clashing with your Grafana server’s port if you decide to set WEB_DASH=True.
Now you can start the container like so:
docker compose up
After a few seconds you should see that the Prometheus exporter is up and running. You can view the metrics by browsing to http://localhost:6711/metrics
To stop the container run:
docker compose down
To run the container in the background:
docker compose up -d
Prometheus Server Configuration
Now that the exporter is up and running we need to tell our Prometheus server to scrape the metrics from the exporter.
Add to your scrape_configs section in /etc/prometheus/prometheus.yml:
scrape_configs:
  - job_name: 'giv_energy'
    static_configs:
      - targets: [ 'localhost:6711' ]
Now restart your Prometheus server:
systemctl restart prometheus
You should now see GivEnergy metrics in Grafana.
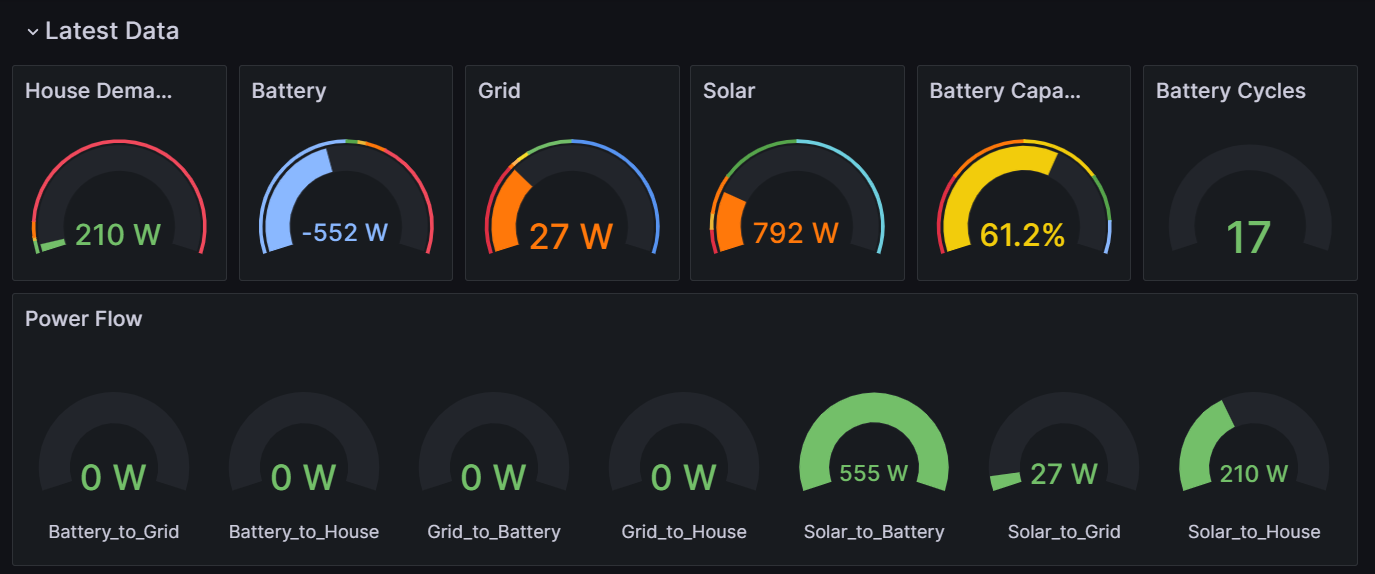
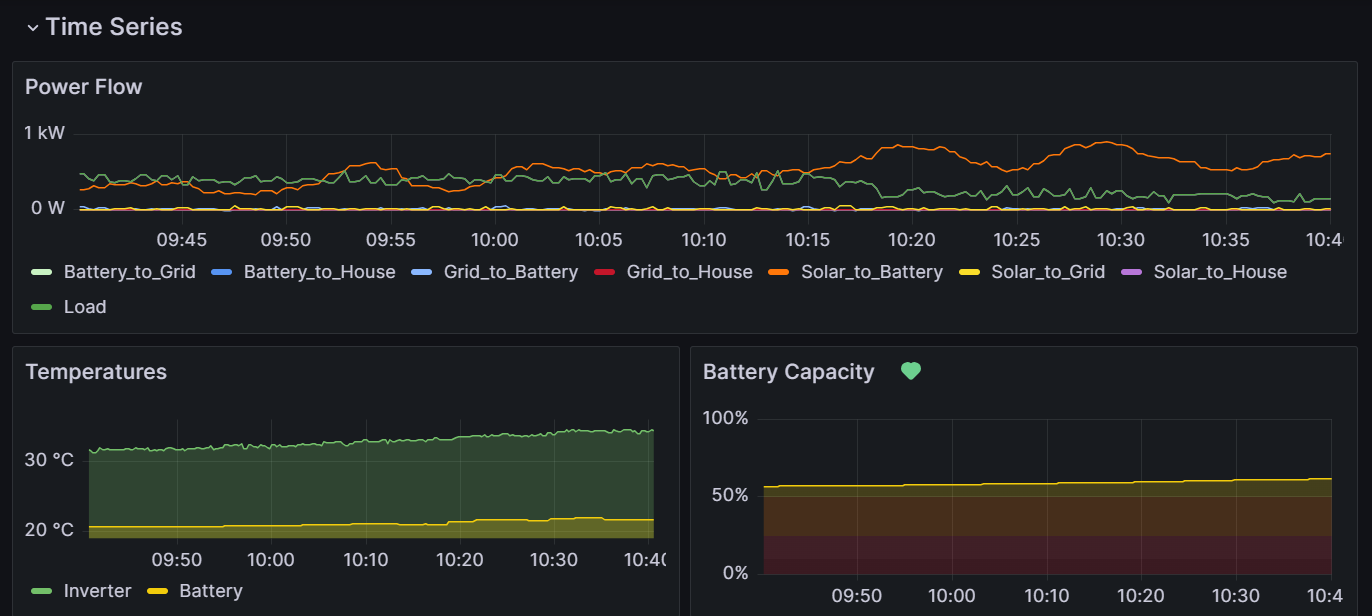
Grafana
Now that Prometheus is scraping metrics from your GivEnergy inverter, here are some example queries you can use:
Power
power{job="giv_energy"}
Power Flows
power_flow{job="giv_energy"}
Battery Capacity
battery_capacity_percentage{job="giv_energy"}
Battery Charge Cycles
battery_cyles_total{job="giv_energy"}